Data Management and Analysis:
Middle Level Ideas

by
Erv Henderson,
Grade Nine Teacher

   The activity and work samples in this section have been contributed by the middle years editorial consultant, Erv Henderson, of Yorkton, SK. The activity described below and the examples of student work all come from his current grade nine class. Erv is piloting the new Saskatchewan Middle Level Mathematics Curriculum and has adapted the following activity from the curriculum. Rather than working with data gathered by others and commercially available, Erv's class decided to conduct a personal survey of how time was spent over a seven-day period and then display the information in a variety of ways. The most enjoyable part of this assignment, he reports, was the organization and illustration of the data. Erv stated that his class had mixed reactions to this assignment. Most children found the assignment unusual--as a math activity, as the mathematics the children were working with was all personally-derived, and it did not come from a text. Some children who had been successful with a previous textbook approach to learning mathematics reported initially that they found this activity difficult, as it required them to think and come up with data to work with. Other children who had not previously experienced great success with the more traditional approach to learning mathematics were quite surprised that what they were doing was mathematics and that they could be successful learning mathematics in this way. The assignment in general helped children understand (1) that data management was a valid part of mathematics, (2) that mathematics was more than stuff from a textbook and/or drill and practice, (3) that they could be producers of data for mathematical activity, and (4) that they could be successful learners and doers of mathematics--and have fun doing it.
 
What the Grade Nine Students Were Asked To Do:
 
  
DATA MANAGEMENT
1.Create a title page.
2. Using a primary data-gathering method, conduct a survey of how you spend your day over a seven-day period. Estimate the time for each activity to the nearest 15 min. Record your results on the sheet provided.
3. Calculate the mean, median, and mode for each of the activities.
4. Create a Frequency Distribution Table for the mean of each activity.
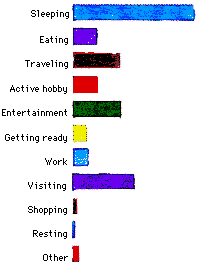
5. Create a Bar Graph and Circle Graph using the mean of each activity.
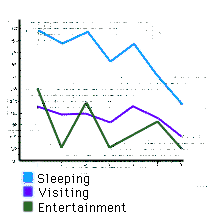
6. Create a Broken Line Graph showing the time spent doing your top three activities over seven days.
7. Interpret your data by answering the following questions:
a) Which days did you sleep the most and the least?
b) Which activities have the greatest and lowest means?
c) Which day did you accomplish the most?
Explain.
d) Which day did you accomplish the least?
Explain.
 
   Following are examples of Brittany Striker's work in response to the above assignment:
 
 
Bar Graph


Brokenline Graph

 
Frequency Distribution Table
 
ActivityMeanMedian  Mode
Sleeping365.71480 540, 480
Eating68.577070, 65
Traveling140.00120120
Active hobby71.426020, 60
Entertainment145.7112060
Getting Ready39.284550
Work44.285060
Visiting184.14195no mode
Shopping17.1400
Resting7.8500
Other45.004545


Questions

7a.Day 1 (Monday) and Day 2 (Wednesday) are the days that I slept the most. I slept 540 minutes on both days. Day 7 (Friday) was the day I slept the least. I slept 240 minutes.
7b.Sleeping has the greatest mean--it's 365.71. Resting has the lowest mean--it's 7.85.
7c.On Day 1 (Monday) I accomplished a lot. I spent most of my time in 1470 minutes.
7d.On Day 7 (Sunday) I accomplished the least. I spent most of my time in 740 minutes.
 

Go to Math Central

To return to the previous page use your browser's back button.