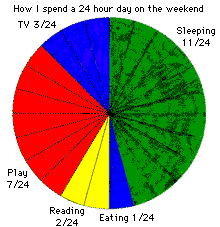
We then discussed:
| What must be the total sum for all the parts of the circle graph? | |
| What patterns do you see in the graphs? |
Day's Graph

GAMES: Students love games and there is no better game than one that prompts students to develop their own grame. The lesson I did with my grade five class involved discussing possible outcomes on a die and how some outcomes are equally likely. In pairs, the students were given two dice and allowed time to make a list of possible sums when rolling the two dice. Students were encouraged to use the language of probability when discussing the outcomes. Students then played the Random Removal Game (Math Quest 2000, Grade 5). This game focuses students' attention on how often various sums for two dice are likely to occur.
Materials: 15 counters per player; 2 dice.
Goal: To remove all your counters first.
Rules:
| 1. | Each player makes a number line from 2 to 12. |
| 2. | Each player makes a line plot by placing 15 counters above numbers on the line, according to the likelihood of that sum being rolled. |
| 3. | To play, a player rolls the two dice and states the sum. He or she removes one counter from that position on his or her number line. If there are no counters at that position, no counter is removed on that turn. |
| 4. | Players take turns rolling the dice, until a player has removed all the counters. |