Making The Connection Patterns and Relations
Alain Gauthier


Students often experience difficulty in Math 10 because they have not made connections between formulas and real life situations. The following experiments can be done with students in middle years or as an introduction to functions in Math 10. Some people might say the Math 10 course is too intense and there is not time for activities and games. These experiments can be conducted in three periods. The advantage is that the students better understand relations and make the connections with their world so that abstract math such as y = mx + b becomes more meaningful for them. This allows students to understand rather than memorize procedures.

Lesson One
(30 minutes) - Teacher directed (works best when the teacher walks students in unison step by step through this lesson). See Experiment 1.
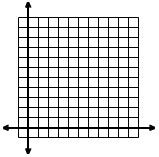
  Have students practice taking their pulse for 15 seconds and multiplying by 4. Then have them run on the spot for three minutes. They immediately take their pulse and record. They continue to do this every minute. Students then make the t-chart and the graph to observe that there usually is a pattern as their pulse goes back to normal. If they compare with friends they will usually see a tendency towards a straight line; however the slope may vary from student to student. (This is dependent on their level of fitness).

Lesson Two
(60 minutes) 10 minutes - teacher directed, 50 minutes pairs at work stations. See Experiment 2.
  Have water boiling in kettles before class starts. Immediately pour 250 mL of water in Pyrex beakers (one per pair). Students record the temperature. Explain to the students that you will interrupt their activities every ten minutes so that one student in the pair can record the temperature of the water as it cools.
  Students then rotate from station to station to conduct the experiments. (Make sure that you have set up multiples of each station so that all students have a place to work. This is possible because the equipment is minimal). Provide each student with a copy of the experiments so that each one can record the data. Emphasize that they will simply collect data at this point.
  Once students have completed the data, ask them to answer the remaining questions.

Lesson Three
Using an overhead of each activity, discuss with students the results of their experiments. Identify those that tended to have a pattern. Change the variables into x and y.
  Students should begin to see what relations 'look like' in the real world as well as make connections between math and science.

 
 Follow up:

   Experiment 2:
Using the heating of the water and the cooling of water will introduce positive and negative slope

Experiments 3, 4, 5:
Changing the number of washers, marbles and pennies will introduce slope and variation.
1.a)Why did we plot in quadrant one of each case?
 b)How could you change experiment two so that you would record in other quadrants? (Freeze the water). Which quadrant would you use? (Quadrant four). Why not quadrants two and three? (You cannot go back in time).
2.a)How does Experiment Six differ from the others? Why?
3.Homework: Now create two experiments of your own. One will demonstrate a pattern or relationship between the variables. The other will be a scatterplot with no relation between the variables.
4.Make posters of each experiment (some students may volunteer to do this) and refer to these experiments as you do the unit to remind the students of the connections between real world situations and math concepts.

 
   Experiment One
1.Record your pulse in the chart below.
2.Run on the spot for 3 minutes.
3.Immediately take your pulse for 15 seconds.
4.Continue at regular intervals of one minute. Record.
Inter
Pulse


5.Make graph to record your results.
6.a)Does your pulse seem to decrease at a constant rate?
 b)If yes, write an expression to represent this.
 c)Use x and y to write the equation to represent the rate of decrease.
7.What does the initial pulse have to do with this experiment?
 
   Experiment Two
1.Heat water until it has boiled for 3 minutes.
2.Pour 250 mL in a Pyrex beaker.
3.Take the temperature and record in the table.
4.Take the temperature at ten minute intervals and record.
5.Make and label a graph to represent your findings.
Time
Temp


6.a)Does the cooling of the water tend to be constant?
 b)If yes, write an expression to represent this.
 c)Use x and y to write the equation to represent the chart above.
7.Suppose you were to take the temperature of cold water. Then you would set it on the stove to heat and you would record the temperature at regular intervals.
 a)How would the graph representing this differ from the experiment you just conducted?
 b)Is there a limit to the values in the graph? Why or why not?
 
   Experiment Three
1.Tie a paper clip in the form of a hook to the end of a rubber band.
2.Measure the length and record in the table below.
3.Add washers (always the same number) at a time and record the length of the elastic.
4.Graph to represent your data.
# of
washers
length of
band
0


5.a)Does the increase in the length of the rubber band tend to be constant?
 b)If yes, write an expression to represent this.
 c)Use x and y to write the equation to represent the chart above.
6.How would your results change if you used a thicker rubber band?
7.How would the graph differ if you used fewer washers at a time? More washers?
 
   Experiment Four
1.Use marbles that are the same size and a graduated cylinder.
2.Fill the container 1/3 full of water and record the level.
3.Add one or two marbles and record the level.
4.Repeat several times always using the same number of marbles.
5.Graph to show the relationship between the number of marbles and the level of the water.
# of
marbles
level of
water
0


6.a)Does the change in the level of the water tend to be constant?
 b)If yes, write an expression to represent this.
 c)Use x and y to write the equation to represent the chart above.
7.How will the graph differ if you use more marbles at a time? Fewer marbles?
8.This experiment can be used to measure cold butter for making cookies. Explain how you would do this. What are the advantages?
 
   Experiment Five
1.Stack 3 pennies. Measure the height. Record below.
2.Continue stacking the pennies (using the same number of pennies) and record each time.
3.Make a graph to record the relationship between the number of pennies and the height of the stack.
# of
pennies
height of
stack
0


4.Write the expression to represent this relationship.
5.Use x and y to write the equation that you used in the chart.
6.From your graph predict how high 100 and 1000 pennies would be.
7.How would your graph differ if you used
 a) one penny?b) 10 pennies
8.How would this compare to another coin such as a quarter?
 
   Experiment Six

Roll the die and record in the chart below.

# of roll
Results
1
 
2
 
3
 
4
 
5...17,18,19,20
 
1.Explain why, in this case, there may be no pattern?
2.Explain why it is not possible to write an expression or an equation when there is no pattern?


Return to Math Central

To return to the previous page use your browser's back button.