CELs
1993
S105.8
To meet a need for resources for the new Math 10 curriculum, the
Saskatchewan Teachers' Federation in cooperation with Saskatchewan
Education Training and Employment, initiated the development of
teacher-prepared unit plans.
A group of teachers who had piloted the course in 1992-93 were invited to a
two and a half day workshop in August, 1993 at the STF. The teachers
worked alone or in pairs to develop a plan for a section of the course.
Jim Beamer, University of Saskatchewan and Lyle Markowski, Saskatchewan
Education Training and Employment acted as resource persons for the
workshop.
Get Into Line!
This unit is designed for the Math 10 Core course unit on Linear Relations.
It covers seven sub-units dealing with the basics of graphing, the graphs
of linear equations, the characteristics of a line, the writing of linear
equations, and three areas of applications: direct and partial variation,
arithmetic sequences and series, and scatterplots.
Most of the unit encourages the students' exploration of the topics without
direct instruction, followed by practice questions and the students' own
creation of problems. The unit attempts to tie the many different concepts
together in order to give the students a more well-rounded perspective on
linear relations.
SUB-UNIT 1: Basics of Graphing
Lesson 1: The Basics of graphing
SUB-UNIT 2: Graphing of Linear Equations
Lesson 2: Linear equations to linear graphs
SUB-UNIT 3: Characteristics of a Line
Lesson 3: Intercepts and slope
Lesson 4: What's in the equation
Lesson 5: Slope, intercepts and the graph of a line
Lesson 6: Special line cases
SUB-UNIT 4: Writing Linear Equations
Lesson 7: The equation from slope and y-intercept
Lesson 8: The equation from slope and a point
Lesson 9: The equation from two points
SUB-UNIT 5: Direct and Partial Variation
Lesson 10: Direct variation
Lesson 11: Partial variation
SUB-UNIT 6: Arithmetic Sequences and Series
Lesson 12: Basics of arithmetic sequences
Lesson 13: Arithmetic means
Lesson 14: Arithmetic series
SUB-UNIT 7: Scatterplots
Lesson 15: Scatterplots
Appendix A: Handouts, Assignments and Projects:
Creative Plotting Assignment
Snap to It!
Scatterplots Project
Quizzes:
Plotting equations by tables of values
Slope and intercepts
What's in the equation of a line
Graphing without a table
Special lines
 Sub-Unit 1: THE BASICS OF GRAPHING
Lesson 1: Basics of Graphing
Overview of Topics:
- Review of graphing on a coordinate plane with extension to a four
quadrant system.
- Introduction to the terminology of graphing.
- Practice in plotting and reading points on a graph.
Teacher Required Materials:
- Road map
- Copies of "The Spider and the Fly" for students (or similar exercise)
- Chemistry Experiments and Principles
Student Required Materials:
- Watch with a second hand (or clock in room)
- Graph paper
- Straight edge
Procedures/Activities:
- To review what the students already know about graphing, have the
students locate places by using the given coordinates. If the map uses
numbers and letters, a discussion of the suitability of this type of system
for mathematical purposes may prove interesting. The students will also
have ideas from science which can be discussed.
Discuss physical situations where negative numbers may be encountered
for example, look at the volume of a compound with respect to temperature
changes (Boyle's Law ‹ see page 71 of Chemistry Experiments and
Principles for a table of values that can be used. This discussion
should lead to the development of the four quadrant system.
- Define for the students: ordered pair, abscissa, ordinate, and axes.
Also, it's beneficial to discuss independent and dependent variables. In
the previous example, if the temperature is changed, the volume will also
change. Since we select the temperature, but measure the volume, the
temperature is the independent variable and should be assigned to the
horizontal axis.
- As a graphing practice, give the students a puzzle to plot.
- To further practice the graphing of points, and of reading points, have
each student plot a picture, message, or design with a minimum of 10
points, and then record the points as ordered pairs. (All four quadrants
should be used). The student should then get another student to plot the
points to see if the same result is achieved. The original puzzle, list of
ordered pairs, and the trial plot can be turned in for evaluation. (See
appendix: Creative Plotting)

- Have the students divide into pairs or groups of threes. Each student
will assume a role as snapper, counter, or timer. (In pairs, snapper and
counter can be combined). As the timer times out periods of 5 to 30
seconds at 5 second intervals, the snapper is to snap their fingers as many
times as possible while keeping a steady pace. It is the counter's job to
record the number of snaps in each time period in a table like the one
below
	Time Interval (Seconds)		Number of Snaps


 		5

		10

 		5

		20

		25

  		30
Before plotting the data, encourage the students to discuss which is the
independent variable. Have the students turn in their graphs. Although
the quadrants need not be the same size, encourage the students to show the
four quadrants. See appendix for an assignment sheet.
Teacher Homework:
For each group graph, copy a grid onto an overhead sheet. Also, find the
equation of the best fit line for their data and record it on the overhead
sheet. This sheet, along with their original graph should be returned to
the students at the beginning of the following lesson.
CELs:
- Personal and Social Value Skills
- Communication
- Creative and Critical Thinking
Evaluation:
- Rating scale on positive participation 0 -3; 5
- Marked graphing project 25
Time Line:
Back to Table of Contents
 Sub-Unit 2: GRAPHING OF LINEAR EQUATIONS
Lesson 2: Linear Equations to Linear Graphs
Overview of Topics:
- Plotting first degree equations from a table of values.
- Recognizing a first degree equation and its relationship to a
straight-line graph.
Teacher Required Materials:
- Overhead sheets and group graphs prepared from the last lesson
- Large graphing grid for demonstration purposes
Student Required Materials:
- Mathematics 10. Brendan Kelly, Paul Atkinson, and Bob
Alexander. Don Mills, ON: Addison Wesley, 1987 (or other text selected by
the teacher).
- Graph paper
- Straight-edge
Procedures/Activities:
- Select an equation, such as y = x - 3, and have the students list
possible things they could be asked to do with the equation. From previous
experience, they should be able to identify substituting a value for a
variable. Have the students give an example. Probe for why they picked
the value and variable they did. Ask if they can make other substitutions.
Encourage the use of a variety of numbers and for both variables. In each
example, list x = __________, y= __________. Ask for ways to organize the
results from each example into a cohesive grouping - lead into a table of
values and sets of ordered pairs:
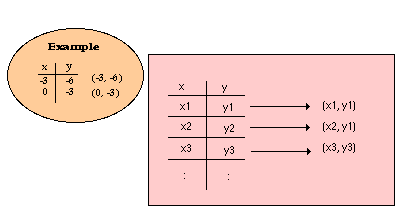
Ask what can now be done with this data ‹lead into a graph. Suggest
evaluating intermediate values for x and y to see what happens between the
points chosen. Encourage the students to discuss the pattern they see and
make hypotheses regarding other values for the variables. Eventually, they
should see that they get a line and that it continues on beyond the
boundary of the graph paper. Brainstorm for ideas on how they might
illustrate this type of continuation on their graphs. (This will help the
students to see how mathematics notation is not necessarily magic, but the
result of historical selections of ideas.)
- Have the students reform their groups from last day and return their
graphs with the overhead sheet with the equation you have prepared. Have
the students create a table of values for their equation, being sure to use
positive and negative values (each group member can contribute two points)
and then graph it on the overhead sheet. They can then match up the origin
of the original and new graphs along with the axes. The group should then
discuss what they see and what it tells them about graphs and equations.
The groups can then report their findings to the class on the relationship
between graphs and equations.
- To practice graphing using a table of values, and to develop an
understanding of the relationship between linear equations and linear
graphs, have the student do some questions from page 166 in Mathematics
10. It is good to do questions that are strictly equations, and those
that have equations given within a word problem. Also have the students
graph a few non-linear equations such as:
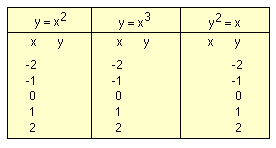
The students should then answer the following questions:
- How are the last three graphs different from the previous graphs?
- How are the last three equations different from the equations of the
previous graphs?
- Make a hypothesis about the relationship between the shape of a graph
and its defining equation?
These three questions can either be discussed only as a class, or also
turned in for evaluation.
CELs:
€ Creative and Critical Thinking
Evaluation:
- Rating scale on positive participation 0 - 5
- Homework completion rating scale 0 - 2
- Plotting equations by tables of values quiz 7
Time Line:
1 - 2 hours
Back to Table of Contents
 Sub-Unit 3: CHARACTERISTICS
OF A LINE
Lesson 3: Intercepts and Slope
Overview of Topics:
- Finding the x and y intercepts.
- Finding the slope of a graph from two points.
Student Required Materials:
- Graph paper
- Straight-edge
- Mathematics: Principles and Process (10). Frank Ebos et al.
Scarborough, ON: Nelson Canada, 1990
Procedures/Activities:
- Present the following problem to the class: When you arrive home
from school one day, you realize that you do not have your house key,
however, you can get intothe garage where there is an extension ladder
stored. You notice that the top window is open, so despite your fear of
heights, you proceed to get the ladder.
What are some of the factors that become important when you set up the ladder?

Look for ideas about the angle at which you place the ladder, where on the
ground it should start, where it needs to end, etc.
- Next ask the students how the ladder situation is like the graph of a
linear equation. Have them sketch different possible placements of the
ladder (line).
Make sure the students remember that lines are continuous, so the question
of length becomes irrelevant. If they are ignoring the lengths of the
ladder, you can discuss what is causing the steepness of the ladder to
change in each situation. They should come up with the idea that the
amount of vertical distance covered with respect to that covered by the
horizontal distance is changing. This will head into the conclusion that
the measure of steepness, slope, is actually a measurement of how fast
height changes as length changes. At this point the following formula can
be presented:

Go over an example such as the one below:
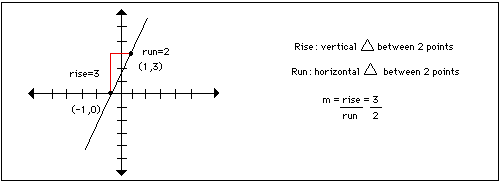
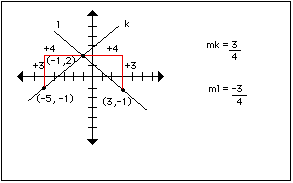
- Next, ask how we might distinguish between two lines that have the same
steepness, but different direction. Look at two lines with the same
steepness, but opposite direction and calculate the slope, stressing the
importance of reading changes from left to right or right to left, but not
to mix and match.
This should lead the students to conclude that for / lines, both the rise
and the run, working left to right are positive changes (or from right to
left both are negative changes), so
rise over run will be positive overall.
Such a line is called an increasing line.
Similarly, for \ lines, one change will be positive and the other will be
negative, so the overall result will be negative. Such a line is called a
decreasing line.
- Brainstorm for places where slopes are important. Ask how the value of
the slope of a particular line, say a ski slope, tells how steep it really
is. Sketch various lines and ask the students to indicate which line has
the greatest slope and which has the least slope. A quick calculation of
the slopes will confirm their hypotheses.
- Now, return to the ladder scenario. Ask the students what other than
the slope must be fixed to give the specific placement of the ladder.
Their conclusion should be either where you place the bottom or the top of
the ladder.
Discuss where, if the ladder were in fact a line on a coordinate grid,
these points would occur on the graph. The students should be able to
identify them as being the points where the graph crosses the x and y axes.
Some discussion can be had on the number of x and y- intercepts that a
linear equation might have. If they decide that any linear equation must
have one x and one y-intercept, you may wish to have them consider a
vertical or horizontal line (eg. y = 3, or x = 5, etc.)
- Have each student sketch a line and identify the coordinates of the x-
and y- intercepts of their line. Their results should be recorded as
ordered pairs on a class chart like the one below:
	x- int                y -int


	(  ,  )                (  , )


	(  ,  )                (  , )
Analysis of this chart should lead the students to conclude that an
x-intercept occurs when y = 0 and that a y-intercept occurs when x = 0. Do
a few examples of calculating these values from an equation.
		 eg.  3x - 2y = 1


	x-int:  let y = 0


		3x - 2(0) = 1


		3x - 1


		x = 1/3            (1/3, 0)


	y-int:  let x = 0


	3(0) - 2y = 1


		-2y = 1


		y = -1/2           (0, -1/2)
- Have the students do a set of practice questions from pages 171 & 172 in Mathematics: Principles and Process (10). (Questions 1-5) and page 161 (Questions 1 and 2)
CELs:
- Creative and Critical Thinking
- Communication
Evaluation:
- Rating scale on positive participation 0 - 5
- Homework completion rating scale 0 - 2
- Slope and intercepts quiz 6
Time Line:
Lesson 4: What's in the Equation
Overview of Topics:a
- Slope and y-intercept values and the slope- y- intercept form of a
linear equation.
- Slope, x-intercept, and y-intercept values from the standard form of a
linear equation. (extension for entire class, or for the more
mathematically confident students).
Student Required Materials:
- Graph paper'
- Mathematics 10
Teacher Required Materials:
Large class table for data collection
Procedures/Activities:
- Assign each student in the class an equation written in standard form
(Ax + By = C). Be sure to give each student an equation within their
ability range. Ask each student to isolate the y in their equation (solve
for y) so that their equation is in the form y = mx + b. You may need to
do 2 or 3 examples of this for them. The results, and the original
equation should then be recorded on the class table.

- Next, have the students graph their relation using a table of values,
and record the results on the class table.
- Once all of the data has been collected, have the students discuss the
results in small groups, and then have the groups report back to the class
as a whole. The conclusion that should be reached is that the slope-
y-intercept form of a linear equation (y= mx + b) clearly gives both the
slope and the y-intercept of the line. (m is the slope, and b is the
y-intercept). As an option to this process, the students may have been in
small groups for the entire procedure, developed a table of data, and then
presented their results to the rest of the class.
- (Optional) The preceding conclusions can be extended by having the
students complete another chart like the one below:

In this case, the students will find that while an equation is written in
standard form, the x-intercept has a value of C/A, the y-intercept has a
value of C/B, and the slope has a value of
-A/B.
- Assign the students some practice problems, such as page 236 in
Mathematics 10 (Questions 1 and 2)
CELs:
- Critical and Creative Thinking
- Personal and Social Values and Skills
Evaluation:
€ Rating scale on positive participation 0 - 5
€ Homework completion rating scale 0 - 2
€ What's in the equation of a line quiz 4
Time Line:
€ 1 - 2 hours
Lesson 5: Slope, Intercepts and the Graph of a Line
Overview of Topics:
1. Graphing from the equation of a line using the x and y-intercepts,
the slope and an ordered pair, and from the slope- y-intercept form of the
equation.
Student Required Materials:
- Graph paper
- Mathematics: Principles and Process (10)
Teacher Required Materials:
- Large grid for class to view
Procedures/Activities:
- Ask students how many points you really need to know in order
to be able to sketch a line. Once they have realized that the answer is
two, ask them to plot the line going through the points (5,3), and (-4,1),
or any such pairing of points. You may also want them to sketch the line
containing the points (7,-3) and the origin. (To review the term origin).
- Next, have the students review the concept of slope. Have them
recall how slope was initially determined. Ask them what a slope of 2/3
tells you. Eventually, they should suggest that between any two points, a
rise of two will result in a run of 3, or that a rise of -2 (going down)
will result in a run of -3 (going backwards).
Have the students consider the following question. On your fifth visit to
Mount Scary, your favourite ski slope, you took measurements of the
steepness of the mountain, which is renowned for its constant slope. You
found that for every six meters of vertical change there was a horizontal
change of 3 meters.
- What is the slope of Mount Scary?
- How could you accurately sketch the mountain?
(This should lead to a discuss of topics such as scale factors, and the
selection of a point of origin ‹ preferably the base of the mountain,
but it could be elsewhere, such as the camp sight or a fire tower.
Eventually, the question of how to use the slope to plot the graph should
arise. Have the students recall how they actually obtained a value for
slope at the beginning of this sub-unit to help come up with a method to
graph the mountain.) Do a few more examples such as:
Graph the line that:
- has a slope of -5/2 and passes through (6,2)
- has a slope of 4 and passes through (-4,8)
- has a slope of -1/3 and has an x-intercept of 4
- has a slope of -1 and has a y-intercept of -3
- has a slope of 2 1/3 and passes through the origin.
Encourage the students to try different sign combinations on the rise and
run values as well as not only seeing whole number slopes as being over 1,
but also as rationals with other denominators.
- Finally, ask the students what they could do to graph an
equation such as 2x - 3y = 6 without creating a table of values. Question
the students on what kinds of information the equation of a line tells us,
and how it might be used to obtain the graph of the equation
- Assign a few practice problems, such as page 236 in
Mathematics: Principles and Process (10) (8-14)
CELs:
- Communication
- Creative and Critical Thinking
Evaluation:
- Rating scale on positive participation 0. - 5
- Homework completion rating scale 0 - 2
- Graphing without a table quiz 8
Time Line:
1 hour
Lesson 6: Special Line Cases
Overview of Topics:
- Slopes of parallel and perpendicular lines
- Slopes of vertical and horizontal lines
Student Required Materials:
- Graph paper
- Mathematics: Principles and Process (10)
Teacher Required Materials:
Completed Special Lines form (see appendix) for each group in the class
for both parallel and perpendicular lines.
Procedures/Activities:
- Have the students work in small groups of three or four. Give
each group a Special Lines form with equations of parallel lines to
complete. Once the groups are done (maximum 15 minutes for completion of
graph and discussion), discuss the results as a group. The students should
quickly recognize the relationship between parallel lines and their slopes.
- Repeat the above procedure using equations of perpendicular lines.
- Divide the class in half. Give one half of the class y = #
equations and the other half x = # equations (one per student). Have the
students from each half report their findings: What does the graph look
like, and what is its slope. A discussion of undefinedness and infinity
will likely occur naturally.
- Assign the students practice questions such as pages 183-185 in
Mathematics: Principles and Process (10) (questions 6-9, 23).
CELs:
- Personal and Social Values and Skills
- Creative and Critical Thinking
- Communication
- Independent Learning
Evaluation:
- Rating scale on positive participation 0 - 5
- Homework completion rating scale 0 - 2
- Special Lines Quiz 5
Time Line:
1 hour
Back to Table of Contents
 Sub-Unit 4: WRITING LINEAR
EQUATIONS
Lesson 7: The Equation from slope and y-intercept
Overview of Topic:
1. Writing the equation of a line where the slope and the y-intercept
are known.
Student Required Materials:
- Mathematics 10
- Mathematics: Principles and Process (10)
- Graph paper
Teacher Required Materials:
- A large grid to graph on.
Procedures/Activities:
- On the large grid, sketch a graph of a line. Have the students
identify the slope, x-intercept, and y-intercept and then ask them how they
could convert this information into an equation for the line. Usually the
students are very quick to realize that all they need to do is substitute
the slope in for m and the y-intercept in for b in the slope- y-intercept
form of a linear equation.
(y= mx + b).
- In pairs, have each student sketch a line, and then derive the
equation. Their partner should then be given the equation to plot. They
should then compare the two graphs to make sure that they are the same.
- Assign some practice questions such as page 193 in
Mathematics: Principles and Process (10) (question 2) or page 236 in
Mathematics 10 (questions 2 and 3).
CELs:
- Creative and Critical Thinking
- Personal and Social Values and Skills
Evaluation:
- Rating scale on positive participation 0 - 5
- Homework completion rating scale 0 - 2
- Writing Equations ‹ Part I quiz 2
Time Line:
1 hour
Lesson 8: The Equation from Slope and a Point
Overview of Topics:
- Recognizing the points on a graph as values that satisfy the
equation of the graph.
- Writing the equation of a line given the slope of the line and
any point on the line.
Student Required Materials:
- Mathematics 10
- Mathematics: Principles and Process (10)
Teacher Required Materials:
- A large graph of a linear equation such as y= x - 3.
Procedures/Activities:
- Have the students consider the graph and the equation that is on
the large grid. Pick a value for x and then find the value for y from the
equation. Then check if the point that you have is in agreement with the
graph. Next, pick a point on the graph and ask the students how they might
show that the point satisfies the equation.
- Have the students do a few questions where they need to verify
that a point satisfies the equation of a line. For example, questions 1,
3, 4, and 5 on page 142 in Mathematics: Principles and Process (10)
can be used. (Note that some of #5 include inequalities, but they may
prove to be an interesting extension.)
- Discuss the following question as a class: If the point (-1, -4)
satisfies the equation y = 2x + b, where x and y are the variables, what
does b have to equal. Once you have established b, ask the students how
you can now get the complete equation.
- Have the students do a few questions on page 143 in Mathematics: Principles and Process (10) (questions 9-11).
- Now, discuss the following question. The plans for a wheelchair
ramp have been drawn up on a grid. How could you determine the equation of
the line representing the ramp? Once the students have been able to answer
the question, have them review the steps of finding the equation of a line
when given the slope and any point.
- Have the students do a few questions on page 242 in
Mathematics 10 (questions 1 and 2).
CELs:
Creative and Critical Thinking
Evaluation:
- Rating scale on positive participation 0 - 5
- Homework completion rating scale 0 - 2
- Writing Equations ‹ Part II quiz 5
Time Line:
1 - 2 hours
Lesson 9: The Equation from Two Points
Overview of Topics:
- Finding the equation of a line when given two points on the line.
Student Required Materials:
Procedures/Activities:
- Ask the students: What can you find if you know two points on a
line. Once they have identified slope, have the students form groups of
two. Each pair is to pick two points and find the slope of the line
containing those two points. Then have each student choose one of the two
points and with the slope, derive the equation of the line from that
information as they did in the last lesson. Have the students compare
their results with each other, form a hypothesis about what they notice,
and then repeat the process with another set of points. Once that is
completed, they should have concluded that given two points on a line, they
need only to find the slope using the two points and then select either
point and the slope to obtain the equation of the line.
- Have the students do practice questions such as page 243 in
Mathematics 10 (question 6).
CELs:
- Personal and Social Values and Skills
- Creative and Critical Thinking
Evaluation:
- Rating scale on positive participation 0 - 5
- Homework completion rating scale 0 - 2
- Writing Equations - Part III quiz 4
Time Line:
1 hour
Back to Table of Contents
 Sub-Unit 5: DIRECT AND
PARTIAL VARIATION
Lesson 10: Direct Variation
Overview of Topics:
- Identifying real-life situations involving direction variation.
- Solve proportions used in direct variations.
- Solve word problems involving direct variations.
Student Required Materials:
Graph paper
Mathematics 10
Mathematics: Principles and Process (10)
Teacher Required Materials:
- Large grid for graphing on
Procedures/Activities
- Use didactic questioning to obtain a student generated definition
of direct variation. eg. What does variation mean to you? What do you
think direct variation would mean? Where would you find examples of direct
variation? In discussing the final answer, write their answers using the
variation symbol

- With the examples the students have generated, have them generate
a table of values for each and then plot them. Discuss what common
graphical properties they are noticing and then write the equations. The
result should be that they get an equation very similar to the slope-
y-intercept form, but always with a y-intercept of 0.
- Have the students compare the initial variation statement (w
µ t) to the resulting equation (w = mt). They should be picking up
upon the constant value being the slope of the line. Define that value to
also be the constant of variation because as the slope it tells us the
constant relationship between the two variables.
- Have the students consider the following problem. Earlier this
year, your parents purchased 2250 L of diesel for the bulk tank on the farm
at a cost of $749.25. Lately, your parents have not been too impressed
with all of your cruising around town, so they have decided to charge you
the bulk price for all of the diesel that you use. If you put 28 L in your
truck, how much will you owe your parents? (Prices for September 6,
1993).
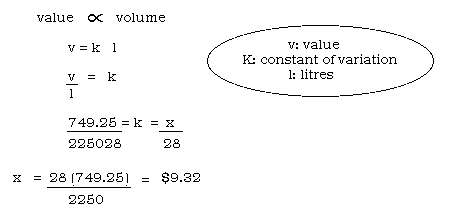
Get the students to try to solve the problem by viewing it as a direct
variation. They should recognize the constant of variation (value/volume)
as the cost per litre. Remind the students that since the points (2250,
$749.25) and (28, ?) belong to the same variation, then the constant of
variation must be the same, which means that a proportion can be set up and
solved.
- Have the students try some of the problems on page 227 in
Mathematics 10 (questions 5-8, 9 extends into squared variations if
time permits) or page 272 - 272 in Mathematics: Principles and Process
(10).
- As an added practice, each student can be required to create a
word problem involving direct variation. The problems can then be
exchanged and used as a review.
CELs:
- Creative and Critical Thinking
- Communication
Evaluation:
- Rating scale on positive participation 0 - 5
- Homework completion rating scale 0 - 2
- Created problem: originality/applicability 5
solving problem 5
Time Line:
1 - 2 hours
Lesson 11: Partial Variation
Overview of Topics
- Identifying and working with partial variations.
- Using partial variations to solve word problems.
Student Required Materials:
- Graph paper
- Mathematics: Principles and Process (10)
Teacher Required Materials:
Procedures/Activities:
- Introduce the topic of partial variation by brainstorming for what
partial means and what in fact partial variation is.
- Have the students consider the following question: When ordering
grad jackets in grade 11, the cost for a jacket involves a fixed price for
the jacket alone, and then a variable cost for all lettering that is to be
added. From one company, the cost of a leather grad jacket is $235 plus
$0.80 per letter that is to be added to the sleeve. Write an equation that
calculates the cost of a jacket with any amount of lettering on it.
Encourage the students to develop a table of values and to plot it. From
there, obtaining the equation should be straightforward.
- Next, have the students compare the equation for the partial
variation with those that they obtained for problems involving direct
variation. They should notice that the constant term that is added on to
the direct variation form is the y-intercept of the graph and that its
value is the fixed value of the question. From this discussion, they
should conclude that a partial variation's equation will have the form
of:
y = mx + b where y and x are the variables
m is the constant of variation
b is the fixed value
- Have the students try some of the problems on pages 286-287 in
Mathematics: Principles and Process (10).
- As a review, each student could be asked to create a partial
variation problem.
CELs:
- Creative and Critical Thinking
Evaluation:
- Rating scale on positive participation 0 - 5
- Homework completion rating scale 0 - 2
- Created problem: originality/applicability 5
solving of problem 5
Time Line:
1 - 2 hours
Back to Table of Contents
 Sub-Unit 6: ARITHMETIC
SEQUENCE AND SERIES
Lesson 12: Basics of Arithmetic Sequences
Overview of Topics:
- Identification and defining of arithmetic sequences.
- Determining the nth term of an arithmetic sequence.
Student Required Materials:
- Graph paper
- Mathematics 12, Brendan Kelly, Paul Atkinson, Bob
Alexander. Don Mills, ON: Addison-Wesley, 1991.
- Math Is/6, Frank Ebos, Mary Crowley, Bob Tuck.
Scarborough, ON: Nelson Canada, 1982
Procedures/Activities:
- Ask the students for examples of sequences in their every day
lives. Encourage the students to think of non-mathematically based
examples such as the sequence of steps to putting on a pair of shoes, or
for baking a cake. Next encourage them to think up examples of
mathematical sequences. Define each value in a sequence (or step) as a
term.
- Once the students are familiar with the concept of a sequence,
carry out the following concept attainment or something similar. Remind
the students that they should not say what they think the rule is until
they are asked.
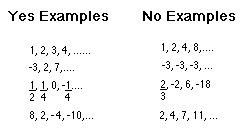
Next, without the students saying what they think the rule is, ask them if
the following are yes or no examples:
a) 5.3,5.9,6.5,...
b) x, x2, x3,...
c) x-1, x+1, x+3,...
d) 2x + 5, 4x+5, 6x+5
Finally, ask the students to identify the characteristics of an arithmetic
sequence:
- adding between terms only
- difference remains the same for all terms
- the difference must be non-zero
3. Ask the students to give the
first five terms of the arithmetic sequence with a first term (called a) of
7 and a common difference of -2. As they give you the terms, write them in
a column and in a row form as below:
		TERM #      		TERM VALUE


     		1        			7

     		2        			5

     		3        			3

     		4        			1

     		5       			-1

 		7, 5, 3, 1, -1, ...
Ask the students if there is some way that a graph of the information
contained in the sequence could be given. The result should be a graph,
with the term # as the independent variable and the term value as the
dependent variable, that is linear. Ask the students to compare the
results with those of partial variations. They should see that the first
term of the sequence is like the fixed value of the partial variation and
that the common difference between the terms is acting in the same way that
the variable constant did in partial variations. The students should then
be able to write the equation for the sequence:
	v = -2n + 7    		v is the value of the term

                       		n is the term number
Next, ask the students how they could use this equation to determine the
value of the 78th term.
		v     	=  -2(78) + 7

      			=  -156 + 7

       			=  -149
As well, ask them how they could use this equation to determine what term
number has a value of -95.
		-95     	=      -2n + 7

		-102    	=     -2n

		51     		=      n
- Develop the general equation for the terms in an arithmetic
sequence, using tn to represent the value of the nth term, n to represent
the term number, a to represent the value of the first term, and d to
represent the common difference.

- Ask the students for an example in real life that an arithmetic
sequence would occur.
eg. A test in one of your classes is out of 100%. Short answer questions
account for 60% of the mark, while the remaining 40% is for 20 multiple
choice questions. When you wrote the test, you were confident that you had
answered all of the short answer question correctly, but you are unsure of
how you did on the multiple choice questions. What possible marks could
you get on the test?
This generates the following sequence of numbers:
60, 62, 64, 66,...
You could then ask the students what the values for a and d are and to
write the general equation for a term in the sequence. Ask the students
what a specific term in the sequence represents. You may also want to ask
the students questions like: How many of the multiple choice questions did
you get correct if your exam mark was 84? Is it possible to have a mark of
87? What is your mark if you got 35 of the multiple choice questions
correct?
- Have the students do some practice problems on pages 376-378 in
Mathematics 12 or on pages 440-445 in Math Is/6.
CELs:
- Creative and Critical Thinking
- Communication
Evaluation:
- Rating scale on positive participation 0 - 5
- Homework completion rating scale 0 - 2
- Arithmetic sequences quiz 7
Time Line:
2 - 3 hours
Lesson 13: Arithmetic Means
Overview of Topics:
- Definition of an arithmetic mean.
- Calculation of arithmetic means.
Student Required Materials:
Procedures/Activities:
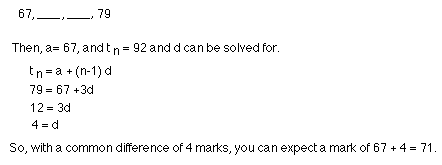
- Have the students consider the following problem. You just
received back a test on which there is only a percentage given. You got 8
questions right and got a mark of 67%, while your friend got 11 questions
right and got a mark of 79%. After going over the exam, you feel that you
actually have one question right that was marked wrong. What mark can you
expect to have if you are correct about the marking error? (Assume that
all questions are worth the same amount and that they are marked on a
completely right, or completely wrong scale).
Although there are variety of ways to solve this problem, try to encourage
the students to set the question up as an arithmetic sequence:
- Define the terms between any two given terms in an arithmetic
sequence as being the arithmetic means of the numbers. Indicate that there
can be any number of means specified. A brief discussion of what a single
mean is will lead into the ideas of average.
- Give the students some sample questions on page 442 in Math Is/6
(questions 18 - 20).
CELs:
- Creative and Critical Thinking
Evaluation:
- Rating scale on positive participation 0 - 5
- Homework completion rating scale 0 - 2
- Arithmetic means quiz 4
Time Line:
Lesson 14: Arithmetic Series
Overview of Topics:
- Finding the sum of an arithmetic series.
Student Required Materials:
Procedures/Activities:
- A useful, general introduction is the "Gauss" problem.
- Define a series as being the sum of the terms in a sequence
(finite number of terms). So if a sequence is:
	3,7,11,15,29,23

	the series is 3+7+11+15+19+23


	for which the value is 78.
- Give the formulae for the sum of an arithmetic series:
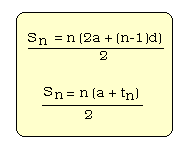
where Sn is the sum of n terms, and a,d, n, and tn are as defined before.
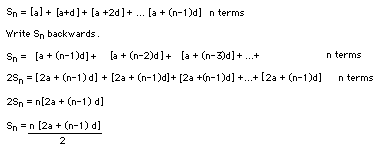
If there is time, or just for the more capable students, the development of
these formulae is beneficial as it gives the students some insight into a
mathematical "trick" that they have not seen before.
- Have the students consider the following problem. When you were
born, your Godmother decided to start a trust fund for you. On your first
birthday she put $25 in the account, on your second birthday she put $35 in
the account, on your third birthday she put $45, and so on ($10 increases
per year). How much money will she have put aside by the time you are
16?
- Have the students do some questions from pages 461-462 in Math
Is/6.
- Extension: Look at summation notation, and index changing.
CELs:
- Communication
- Creative and Critical Thinking
Evaluation:
- Rating scale on positive participation 0 - 5
- Homework completion rating scale 0 - 2
- Arithmetic series quiz 3
Time Line:
1 - 2 hours
Back to Table of Contents
 Sub-Unit 7: SCATTERPLOTS
Lesson 15: Scatterplots
Overview of Topics:
- Collecting data for and preparing scatterplots.
- Analyzing the scatterplots.
- Construction of a 'best fit' line by sight.
Student Required Materials:
Teacher Required Materials:
- Timer
- Large graphing grid
Procedures/Activities:
- Divide students into 3 groups. If possible, it is best to work in
a hallway or gymnasium. Assign the groups as slow, medium, and fast
walkers. Have the students walk for a specific time, about 2 minutes, at
their designated speed. It is their job to keep track of the number of
steps they have taken. Once they are done, have them take their pulse.
This data should then be recorded on a table like the one below:

Plot the data on the large grid and then discuss the results - ask them for
conclusions and interpretation. Eventually this should lead to the idea of
the results being linear and obtaining a 'best fit' line by sight. Some
mention should be given to the fact that there are statistical methods for
determining an exact line of best fit, but for now the line will only be
approximated. Have the students locate a line that they feel is the 'best
fit' line and then determine its equation. Discuss how the equation could
be then used in the interpretation of the data.
- Have the students form groups of 3 or 4. Each group is to select
an experiment that will generate a linear scatterplot. (For examples see
Algebra Experiments I: Exploring Linear Functions ‹ anything
with a basically constant rate of change will do). Once their experiment
has met your approval they are to carry it out, record the necessary data,
plot the data, give a written analysis of the results, and draw in the best
fit line and determine its equation. Once this is completed, the group is
to make up a visual display of their results and present it to the class.
- To review scatterplots, the following synectic presentation could
be used. Ask students:
- How is a scatterplot like a shopping mall?
- How is a scatterplot unlike a shopping mall?
- How would it feel to be someone attempting to get from one point in the
mall to another?
- How would it feel to be a point in a scatterplot? (Include both the
points on the 'best fit' line and not on the 'best fit' line).
- What else could you compare a scatterplot to?
- Why?
For the last question, you may have them turn in their answers for
marks, or just for assessment of their understanding.
CELs:
- Personal and Social Values and Skills
- Communication
- Creative and Critical Thinking
- Numeracy
Evaluation:
- Rating scale on positive participation 0 - 5
- Scatterplots Project 25
- Scatteplot Analogy 5
Time Line:
3 hours maximum
Back to Table of Contents
 Appendix A: HANDOUTS, ASSIGNMENTS AND PROJECTS
(Only a few of the handouts, assignments and projects have been chosen to
be put into this html document. To obtain a copy of the rest of the
handouts...ect you can download them from the PDF file.)
Creative Plotting
Task:
- Using a minimum of 10 points (maximum 25), plot a picture, message
or design on a piece of graph paper. Make sure that you have points in
each of the four quadrants.
- Make a list of the points that you have plotted as ordered pairs.
If the order of the points is important, be sure to indicate it along with
the list of points.
- Have someone else in the class take your list of points and plot
them on a separate piece of graph paper.
Turn in:
- Your original plotting of the points.
- Your list of points and instructions.
- The plotting of your points done by another student.
Marking Scheme:
Originality/Creativity: (5 MARKS)
Accuracy of listed points and instructions: (10MARKS)
Accuracy of plotting (10 MARKS)
Snap To It!
In your groups of three, each person must assume one of the following roles:
If your group only has two people in it, the snapper and counter can be
combined into one job.
What to do...
- The timer will time out periods of time starting with 5 seconds, and
progressing to 30 seconds at 5 second intervals. During the timings, the
snapper is to snap their fingers (at as constant a speed as is possible) as
many times in the time period as they can. It is the counter's job to
count the number of finger snaps that are done in each timed period and to
record the results in the table below:
Time Interval (Seconds) Number of Snaps
5
10
15
20
25
30
- Decide which variable, time or number, is the independent variable
and then graph the result. Although there are no negative values involved,
you should still show all four quadrants, but they do not need to be the
same size.
- Turn in your graph. Be sure to clearly identify your group members
on the graph.
Scatterplot Project
Task:
- In your group of 3 or 4 people, select an experiment whose data
should generate basically linear data and have it approved by the
teacher.
- Carry out the experiment. Carefully collect and record the data
from the experiment.
- Analyze the data by:
- graphing
- sketching the 'best fit' line
- finding the equation of the 'best fit' line
- writing up conclusions or hypotheses that you feel can be made from
your data and an explanation why
- Create a visual presentation for your experiment. It should
clearly represent your data and should explain the results that you were
able to obtain. Neatness and creativity of the presentation are also import
ant.
Turn in:
- data
- analysis
- visual presentation
Marks:
Originality of Experiment 		(3Marks)

Recorded data 		(2 Marks)

Written analysis of experiment  		(10 Marks)

Clarify of visual presentation 		(5  Marks)

Neatness/Creativity 		(5 Marks)
Back to Table of Contents
 Appendix: QUIZZES
(For a complete list of quizzes download copies from the PDF file.)
- Plotting Equations by Tables of Values quiz
Create a table of values for the relation y = 3x +2 (3 points minimum),
then graph the results on graph paper.
- Table of Values 3
- Graph 4
- Total 7
- Slope and Intercepts quiz
Find the x-intercept, y-intercept and slope of the line defined by the
equation y = 2x + 4.
- What's In the Equation of a Line quiz
Write the equation 3x -5y =2 in slope- y-intercept form. Then identify the
slope and the y-intercept.
Graph.
- Graphing Without a Table
Graph the equation y = 7x + 5 on the grid provided below without using a
table of values. Be sure to indicate how you are doing this.
- Special Lines quiz
- What is the slope of a line which is parallel to the line 2x + y = 3?
- What is the slope of a line perpendicular to the line y = -3x + 4?
- What type of line is given by the equation x = -6?
This unit comes from the The Stewart Resources Centre which provides
library resources and teacher-prepared materials for teachers in Saskatchewan.
To borrow materials or obtain a free catalogue listing unit and lesson
plans contact :
Stewart Resources Centre,
Sask. Teachers' Federation,
2317 Arlington Avenue,
Saskatoon, SK S7J 2H8;
phone 306-373-1660; fax 306-374-1122,
e-mail src@stf.sk.ca.
http://www.stf.sk.ca/
Go to Math Central
To return to the previous page use your browser's back button.


 Sub-Unit 1: THE BASICS OF GRAPHING

 Sub-Unit 2: GRAPHING OF LINEAR EQUATIONS


 Sub-Unit 3: CHARACTERISTICS
OF A LINE


 Sub-Unit 4: WRITING LINEAR
EQUATIONS
 Sub-Unit 5: DIRECT AND
PARTIAL VARIATION


 Sub-Unit 6: ARITHMETIC
SEQUENCE AND SERIES


 Sub-Unit 7: SCATTERPLOTS

 Appendix A: HANDOUTS, ASSIGNMENTS AND PROJECTS
 Appendix: QUIZZES